 EMODnet Product Catalogue
ARPA Friuli-Venezia Giulia - Alto Adriatico Observatory
Type of resources
Available actions
Topics
Keywords
Contact for the resource
Provided by
Years
Formats
Representation types
Scale 1:
Resolution
-
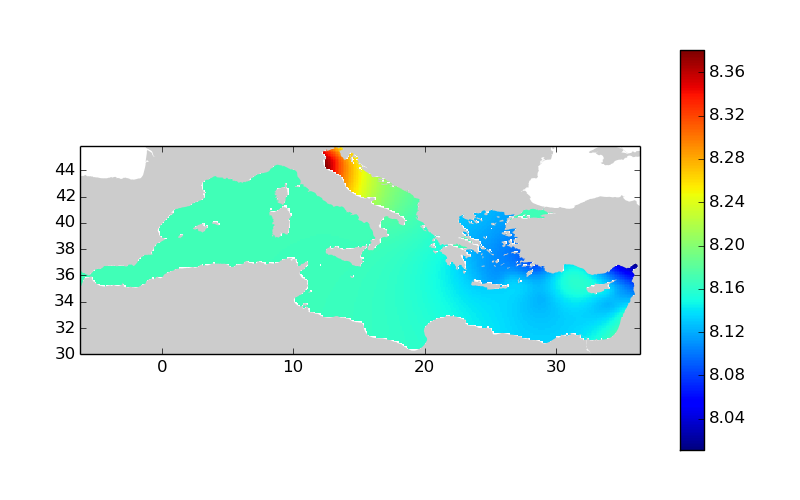
Moving 10-years analysis of pH at Mediterranean Sea for each season : - winter (January-March), - spring (April-June), - summer (July-September), - autumn (October-December). Every year of the time dimension corresponds to the 10-year centered average of each season. Decades span from 1959-1968 until 2005-2014. Observational data span from 1930 to 2014. Depth range (IODE standard depths): -1500.0, -1400.0, -1300.0, -1200.0, -1100.0, -1000.0, -900.0, -800.0, -700.0, -600.0, -500.0, -400.0, -300.0, -250.0, -200.0, -150.0, -125.0, -100.0, -75.0, -50.0, -30.0, -20.0, -10.0, -5.0, -0.0. Data Sources: observational data from SeaDataNet/EMODNet Chemistry Data Network. Description of DIVA analysis: Geostatistical data analysis by DIVA (Data-Interpolating Variational Analysis) tool. Profiles were interpolated at standard depths using weighted parabolic interpolation algorithm (Reiniger and Ross, 1968). GEBCO 1min topography is used for the contouring preparation. Analyzed filed masked using relative error threshold 0.3 and 0.5. DIVA settings: A constant value for signal-to-noise ratio was used equal to 1. Correlation length was optimized and filtered vertically and a seasonally-averaged profile was used. Logarithmic transformation applied to the data prior to the analysis. Background field: the data mean value is subtracted from the data. Detrending of data: no. Advection constraint applied: no. Originators of Italian data sets-List of contributors: o Brunetti Fabio (OGS) o Cardin Vanessa, Bensi Manuel doi:10.6092/36728450-4296-4e6a-967d-d5b6da55f306 o Cardin Vanessa, Bensi Manuel, Ursella Laura, Siena Giuseppe doi:10.6092/f8e6d18e-f877-4aa5-a983-a03b06ccb987 o Cataletto Bruno (OGS) o Cinzia Comici Cinzia (OGS) o Civitarese Giuseppe (OGS) o DeVittor Cinzia (OGS) o Giani Michele (OGS) o Kovacevic Vedrana (OGS) o Mosetti Renzo (OGS) o Solidoro C.,Beran A.,Cataletto B.,Celussi M.,Cibic T.,Comici C.,Del Negro P.,De Vittor C.,Minocci M.,Monti M.,Fabbro C.,Falconi C.,Franzo A.,Libralato S.,Lipizer M.,Negussanti J.S.,Russel H.,Valli G., doi:10.6092/e5518899-b914-43b0-8139-023718aa63f5 o Celio Massimo (ARPA FVG) o Malaguti Antonella (ENEA) o Fonda Umani Serena (UNITS) o Bignami Francesco (ISAC/CNR) o Boldrini Alfredo (ISMAR/CNR) o Marini Mauro (ISMAR/CNR) o Miserocchi Stefano (ISMAR/CNR) o Zaccone Renata (IAMC/CNR) o Lavezza, R., Dubroca, L. F. C., Ludicone, D., Kress, N., Herut, B., Civitarese, G., Cruzado, A., Lefèvre, D., Souvermezoglou, E., Yilmaz, A., Tugrul, S., and Ribera d'Alcala, M.: Compilation of quality controlled nutrient profiles from the Mediterranean Sea, doi:10.1594/PANGAEA.771907, 2011. Units: pH units
-

Moving 10-years analysis of chlorophyll-a at Mediterranean Sea for each season : - winter (January-March), - spring (April-June), - summer (July-September), - autumn (October-December). Every year of the time dimension corresponds to the 10-year centered average of each season. Decades span from 1972-1981 until 2006-2015. Observational data span from 1911 to 2015. Depth range (IODE standard depths): -2500.0, -2000.0, -1750.0, -1500.0, -1400.0, -1300.0, -1200.0, -1100.0, -1000.0, -900.0, -800.0, -700.0, -600.0, -500.0, -400.0, -300.0, -250.0, -200.0, -150.0, -125.0, -100.0, -75.0, -50.0, -30.0, -20.0, -10.0, -5.0, -0.0. Data Sources: observational data from SeaDataNet/EMODNet Chemistry Data Network. Description of DIVA analysis: Geostatistical data analysis by DIVA (Data-Interpolating Variational Analysis) tool. Profiles were interpolated at standard depths using weighted parabolic interpolation algorithm (Reiniger and Ross, 1968). GEBCO 1min topography is used for the contouring preparation. Analyzed filed masked using relative error threshold 0.3 and 0.5. DIVA settings: A constant value for signal-to-noise ratio was used equal to 1. Correlation length was optimized and filtered vertically and a seasonally-averaged profile was used. Logarithmic transformation applied to the data prior to the analysis. Background field: the data mean value is subtracted from the data. Detrending of data: no. Advection constraint applied: no. Originators of Italian data sets-List of contributors: o Brunetti Fabio (OGS) o Cardin Vanessa, Bensi Manuel doi:10.6092/36728450-4296-4e6a-967d-d5b6da55f306 o Cardin Vanessa, Bensi Manuel, Ursella Laura, Siena Giuseppe doi:10.6092/f8e6d18e-f877-4aa5-a983-a03b06ccb987 o Cataletto Bruno (OGS) o Cinzia Comici Cinzia (OGS) o Civitarese Giuseppe (OGS) o DeVittor Cinzia (OGS) o Giani Michele (OGS) o Kovacevic Vedrana (OGS) o Mosetti Renzo (OGS) o Solidoro C.,Beran A.,Cataletto B.,Celussi M.,Cibic T.,Comici C.,Del Negro P.,De Vittor C.,Minocci M.,Monti M.,Fabbro C.,Falconi C.,Franzo A.,Libralato S.,Lipizer M.,Negussanti J.S.,Russel H.,Valli G., doi:10.6092/e5518899-b914-43b0-8139-023718aa63f5 o Celio Massimo (ARPA FVG) o Malaguti Antonella (ENEA) o Fonda Umani Serena (UNITS) o Bignami Francesco (ISAC/CNR) o Boldrini Alfredo (ISMAR/CNR) o Marini Mauro (ISMAR/CNR) o Miserocchi Stefano (ISMAR/CNR) o Zaccone Renata (IAMC/CNR) o Lavezza, R., Dubroca, L. F. C., Ludicone, D., Kress, N., Herut, B., Civitarese, G., Cruzado, A., Lefèvre, D., Souvermezoglou, E., Yilmaz, A., Tugrul, S., and Ribera d'Alcala, M.: Compilation of quality controlled nutrient profiles from the Mediterranean Sea, doi:10.1594/PANGAEA.771907, 2011. Units: mg/m^3
-
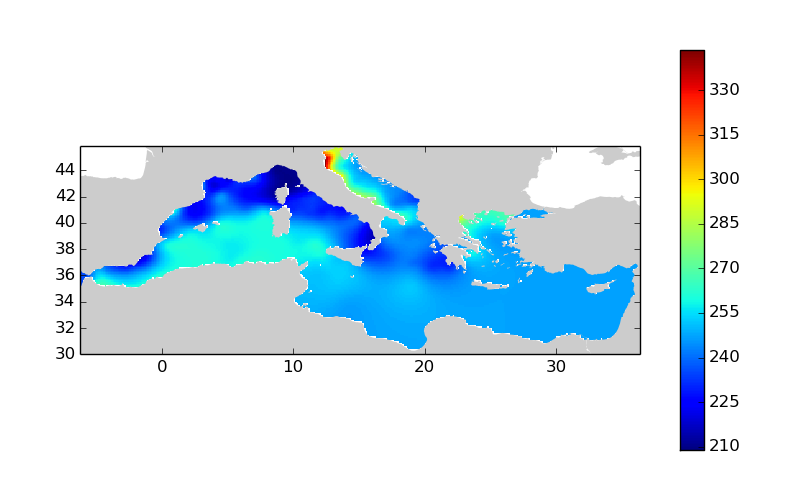
Moving 10-years analysis of dissolved_oxygen_concentration at Mediterranean Sea for each season : - winter (January-March), - spring (April-June), - summer (July-September), - autumn (October-December). Every year of the time dimension corresponds to the 10-year centered average of each season. Decades span from 1971-1980 until 2006-2015. Observational data span from 1911 to 2015. Depth range (IODE standard depths):-3000.0, -2500.0, -2000.0, -1750.0, -1500.0, -1400.0, -1300.0, -1200.0, -1100.0, -1000.0, -900.0, -800.0, -700.0, -600.0, -500.0, -400.0, -300.0, -250.0, -200.0, -150.0, -125.0, -100.0, -75.0, -50.0, -30.0, -20.0, -10.0, -5.0, -0.0. Data Sources: observational data from SeaDataNet/EMODNet Chemistry Data Network. Description of DIVA analysis: Geostatistical data analysis by DIVA (Data-Interpolating Variational Analysis) tool. Profiles were interpolated at standard depths using weighted parabolic interpolation algorithm (Reiniger and Ross, 1968). GEBCO 1min topography is used for the contouring preparation. Analyzed filed masked using relative error threshold 0.3 and 0.5. DIVA settings: A constant value for signal-to-noise ratio was used equal to 1. Correlation length was optimized and filtered vertically and a seasonally-averaged profile was used. Logarithmic transformation applied to the data prior to the analysis. Background field: the data mean value is subtracted from the data. Detrending of data: no. Advection constraint applied: no. Originators of Italian data sets-List of contributors: o Brunetti Fabio (OGS) o Cardin Vanessa, Bensi Manuel doi:10.6092/36728450-4296-4e6a-967d-d5b6da55f306 o Cardin Vanessa, Bensi Manuel, Ursella Laura, Siena Giuseppe doi:10.6092/f8e6d18e-f877-4aa5-a983-a03b06ccb987 o Cataletto Bruno (OGS) o Cinzia Comici Cinzia (OGS) o Civitarese Giuseppe (OGS) o DeVittor Cinzia (OGS) o Giani Michele (OGS) o Kovacevic Vedrana (OGS) o Mosetti Renzo (OGS) o Solidoro C.,Beran A.,Cataletto B.,Celussi M.,Cibic T.,Comici C.,Del Negro P.,De Vittor C.,Minocci M.,Monti M.,Fabbro C.,Falconi C.,Franzo A.,Libralato S.,Lipizer M.,Negussanti J.S.,Russel H.,Valli G., doi:10.6092/e5518899-b914-43b0-8139-023718aa63f5 o Celio Massimo (ARPA FVG) o Malaguti Antonella (ENEA) o Fonda Umani Serena (UNITS) o Bignami Francesco (ISAC/CNR) o Boldrini Alfredo (ISMAR/CNR) o Marini Mauro (ISMAR/CNR) o Miserocchi Stefano (ISMAR/CNR) o Zaccone Renata (IAMC/CNR) o Lavezza, R., Dubroca, L. F. C., Ludicone, D., Kress, N., Herut, B., Civitarese, G., Cruzado, A., Lefèvre, D., Souvermezoglou, E., Yilmaz, A., Tugrul, S., and Ribera d'Alcala, M.: Compilation of quality controlled nutrient profiles from the Mediterranean Sea, doi:10.1594/PANGAEA.771907, 2011. Units: umol/l
-
This product displays the stations present in EMODnet validated dataset where fluoranthene levels have been measured in sediment. EMODnet Chemistry has included the gathering of contaminants data since the beginning of the project in 2009. For the maps for EMODnet Chemistry Phase III, it was requested to plot data per matrix (water,sediment, biota), per biological entity and per chemical substance. The series of relevant map products have been developed according to the criteria D8C1 of the MSFD Directive, specifically focusing on the requirements under the new Commission Decision 2017/848 (17th May 2017). The Commission Decision points to relevant threshold values that are specified in the WFD, as well as relating how these contaminants should be expressed (units and matrix etc.) through the related Directives i.e. Priority substances for Water. EU EQS Directive does not fix any threshold values in sediments. On the contrary Regional Sea Conventions provide some of them, and these values have been taken into account for the development of the visualization products. To produce the maps the following process has been followed: 1. Data collection through SeaDataNet standards (CDI+ODV) 2. Harvesting, harmonization, validation and P01 code decomposition of data 3. SQL query on data sets from point 2 4. Production of map with each point representing at least one record that match the criteria The harmonization of all the data has been the most challenging task considering the heterogeneity of the data sources, sampling protocols. Preliminary processing were necessary to harmonize all the data : • For water: contaminants in the dissolved phase; • For sediment: data on total sediment (regardless of size class) or size class < 2000 μm • For biota: contaminant data will focus on molluscs, on fish (only in the muscle), and on crustaceans • Exclusion of data values equal to 0
-
This product displays the stations where benzo[A]pyrene has been measured and the values present in EMODnet Chemistry infrastructure are always above the limit of detection or quantification (LOD/LOQ), i.e quality value equal to 1. It is necessary to take into account that LOD/LOQ can change with time. These products aggregate data by station, producing only one final value for each station (above, below or above/below). EMODnet Chemistry has included the gathering of contaminants data since the beginning of the project in 2009. For the maps for EMODnet Chemistry Phase III, it was requested to plot data per matrix (water,sediment, biota), per biological entity and per chemical substance. The series of relevant map products have been developed according to the criteria D8C1 of the MSFD Directive, specifically focusing on the requirements under the new Commission Decision 2017/848 (17th May 2017). The Commission Decision points to relevant threshold values that are specified in the WFD, as well as relating how these contaminants should be expressed (units and matrix etc.) through the related Directives i.e. Priority substances for Water. EU EQS Directive does not fix any threshold values in sediments. On the contrary Regional Sea Conventions provide some of them, and these values have been taken into account for the development of the visualization products. To produce the maps the following process has been followed: 1. Data collection through SeaDataNet standards (CDI+ODV) 2. Harvesting, harmonization, validation and P01 code decomposition of data 3. SQL query on data sets from point 2 4. Production of map with each point representing at least one record that match the criteria The harmonization of all the data has been the most challenging task considering the heterogeneity of the data sources, sampling protocols. Preliminary processing were necessary to harmonize all the data : • For water: contaminants in the dissolved phase; • For sediment: data on total sediment (regardless of size class) or size class < 2000 μm • For biota: contaminant data will focus on molluscs, on fish (only in the muscle), and on crustaceans • Exclusion of data values equal to 0
-
This product displays the stations present in EMODnet validated dataset where mercury levels have been measured in water. EMODnet Chemistry has included the gathering of contaminants data since the beginning of the project in 2009. For the maps for EMODnet Chemistry Phase III, it was requested to plot data per matrix (water,sediment, biota), per biological entity and per chemical substance. The series of relevant map products have been developed according to the criteria D8C1 of the MSFD Directive, specifically focusing on the requirements under the new Commission Decision 2017/848 (17th May 2017). The Commission Decision points to relevant threshold values that are specified in the WFD, as well as relating how these contaminants should be expressed (units and matrix etc.) through the related Directives i.e. Priority substances for Water. EU EQS Directive does not fix any threshold values in sediments. On the contrary Regional Sea Conventions provide some of them, and these values have been taken into account for the development of the visualization products. To produce the maps the following process has been followed: 1. Data collection through SeaDataNet standards (CDI+ODV) 2. Harvesting, harmonization, validation and P01 code decomposition of data 3. SQL query on data sets from point 2 4. Production of map with each point representing at least one record that match the criteria The harmonization of all the data has been the most challenging task considering the heterogeneity of the data sources, sampling protocols. Preliminary processing were necessary to harmonize all the data : • For water: contaminants in the dissolved phase; • For sediment: data on total sediment (regardless of size class) or size class < 2000 μm • For biota: contaminant data will focus on molluscs, on fish (only in the muscle), and on crustaceans • Exclusion of data values equal to 0
-
This product displays the stations present in EMODnet validated dataset where naphthalene levels have been measured in water. EMODnet Chemistry has included the gathering of contaminants data since the beginning of the project in 2009. For the maps for EMODnet Chemistry Phase III, it was requested to plot data per matrix (water,sediment, biota), per biological entity and per chemical substance. The series of relevant map products have been developed according to the criteria D8C1 of the MSFD Directive, specifically focusing on the requirements under the new Commission Decision 2017/848 (17th May 2017). The Commission Decision points to relevant threshold values that are specified in the WFD, as well as relating how these contaminants should be expressed (units and matrix etc.) through the related Directives i.e. Priority substances for Water. EU EQS Directive does not fix any threshold values in sediments. On the contrary Regional Sea Conventions provide some of them, and these values have been taken into account for the development of the visualization products. To produce the maps the following process has been followed: 1. Data collection through SeaDataNet standards (CDI+ODV) 2. Harvesting, harmonization, validation and P01 code decomposition of data 3. SQL query on data sets from point 2 4. Production of map with each point representing at least one record that match the criteria The harmonization of all the data has been the most challenging task considering the heterogeneity of the data sources, sampling protocols. Preliminary processing were necessary to harmonize all the data : • For water: contaminants in the dissolved phase; • For sediment: data on total sediment (regardless of size class) or size class < 2000 μm • For biota: contaminant data will focus on molluscs, on fish (only in the muscle), and on crustaceans • Exclusion of data values equal to 0
-
This product displays the stations present in EMODnet validated dataset where benzo[A]pyrene levels have been measured in biota. EMODnet Chemistry has included the gathering of contaminants data since the beginning of the project in 2009. For the maps for EMODnet Chemistry Phase III, it was requested to plot data per matrix (water,sediment, biota), per biological entity and per chemical substance. The series of relevant map products have been developed according to the criteria D8C1 of the MSFD Directive, specifically focusing on the requirements under the new Commission Decision 2017/848 (17th May 2017). The Commission Decision points to relevant threshold values that are specified in the WFD, as well as relating how these contaminants should be expressed (units and matrix etc.) through the related Directives i.e. Priority substances for Water. EU EQS Directive does not fix any threshold values in sediments. On the contrary Regional Sea Conventions provide some of them, and these values have been taken into account for the development of the visualization products. To produce the maps the following process has been followed: 1. Data collection through SeaDataNet standards (CDI+ODV) 2. Harvesting, harmonization, validation and P01 code decomposition of data 3. SQL query on data sets from point 2 4. Production of map with each point representing at least one record that match the criteria The harmonization of all the data has been the most challenging task considering the heterogeneity of the data sources, sampling protocols. Preliminary processing were necessary to harmonize all the data : • For water: contaminants in the dissolved phase; • For sediment: data on total sediment (regardless of size class) or size class < 2000 μm • For biota: contaminant data will focus on molluscs, on fish (only in the muscle), and on crustaceans • Exclusion of data values equal to 0
-
This product displays the stations where naphthalene has been measured and the values present in EMODnet Chemistry infrastructure are always below the limit of detection or quantification (LOD/LOQ), i.e quality values found in EMODnet validated dataset can be equal to 6 or Q. It is necessary to take into account that LOD/LOQ can change with time. These products aggregate data by station, producing only one final value for each station (above, below or above/below). EMODnet Chemistry has included the gathering of contaminants data since the beginning of the project in 2009. For the maps for EMODnet Chemistry Phase III, it was requested to plot data per matrix (water,sediment, biota), per biological entity and per chemical substance. The series of relevant map products have been developed according to the criteria D8C1 of the MSFD Directive, specifically focusing on the requirements under the new Commission Decision 2017/848 (17th May 2017). The Commission Decision points to relevant threshold values that are specified in the WFD, as well as relating how these contaminants should be expressed (units and matrix etc.) through the related Directives i.e. Priority substances for Water. EU EQS Directive does not fix any threshold values in sediments. On the contrary Regional Sea Conventions provide some of them, and these values have been taken into account for the development of the visualization products. To produce the maps the following process has been followed: 1. Data collection through SeaDataNet standards (CDI+ODV) 2. Harvesting, harmonization, validation and P01 code decomposition of data 3. SQL query on data sets from point 2 4. Production of map with each point representing at least one record that match the criteria The harmonization of all the data has been the most challenging task considering the heterogeneity of the data sources, sampling protocols. Preliminary processing were necessary to harmonize all the data : • For water: contaminants in the dissolved phase; • For sediment: data on total sediment (regardless of size class) or size class < 2000 μm • For biota: contaminant data will focus on molluscs, on fish (only in the muscle), and on crustaceans • Exclusion of data values equal to 0
-
This product displays the stations present in EMODnet validated dataset where naphthalene levels have been measured in biota. EMODnet Chemistry has included the gathering of contaminants data since the beginning of the project in 2009. For the maps for EMODnet Chemistry Phase III, it was requested to plot data per matrix (water,sediment, biota), per biological entity and per chemical substance. The series of relevant map products have been developed according to the criteria D8C1 of the MSFD Directive, specifically focusing on the requirements under the new Commission Decision 2017/848 (17th May 2017). The Commission Decision points to relevant threshold values that are specified in the WFD, as well as relating how these contaminants should be expressed (units and matrix etc.) through the related Directives i.e. Priority substances for Water. EU EQS Directive does not fix any threshold values in sediments. On the contrary Regional Sea Conventions provide some of them, and these values have been taken into account for the development of the visualization products. To produce the maps the following process has been followed: 1. Data collection through SeaDataNet standards (CDI+ODV) 2. Harvesting, harmonization, validation and P01 code decomposition of data 3. SQL query on data sets from point 2 4. Production of map with each point representing at least one record that match the criteria The harmonization of all the data has been the most challenging task considering the heterogeneity of the data sources, sampling protocols. Preliminary processing were necessary to harmonize all the data : • For water: contaminants in the dissolved phase; • For sediment: data on total sediment (regardless of size class) or size class < 2000 μm • For biota: contaminant data will focus on molluscs, on fish (only in the muscle), and on crustaceans • Exclusion of data values equal to 0